How to Use Fiddler: A Complete Guide for Troubleshooting HTTP/HTTPS Traffic
What is Fiddler?
Fiddler is a free web debugging proxy tool that captures all HTTP and HTTPS traffic between your computer and the internet or servers. It helps you inspect, debug, and modify web requests and responses, making it a must-have tool for developers, testers, and network admins troubleshooting web applications and APIs.
When to Use Fiddler?
Use Fiddler when you want to:
Debug web applications: Find out why a webpage or web app isn’t loading properly or is slow.
Inspect API calls: View detailed REST API requests and responses, including headers, payloads, and status codes.
Troubleshoot SSL/TLS issues: Identify problems with HTTPS, certificates, redirects, or encryption.
Analyze authentication problems: Check cookies, tokens, OAuth headers for login or access failures.
Simulate network conditions: Slow down requests, block resources, or modify server responses to test app behavior.
Test error handling: Mock server errors to verify how your app responds.
Monitor or filter traffic: Focus on specific hosts, domains, or HTTP status codes.
How to Use Fiddler: Step-by-Step
1. Download and Install Fiddler
Go to the official Telerik site: https://www.telerik.com/fiddler
Download Fiddler Everywhere (cross-platform) or Fiddler Classic (Windows-only).
Follow the installer prompts to complete installation.
Go to the official Telerik site: https://www.telerik.com/fiddler
Download Fiddler Everywhere (cross-platform) or Fiddler Classic (Windows-only).
Follow the installer prompts to complete installation.
2. Launch Fiddler and Configure HTTPS Decryption
Open Fiddler.
Go to Tools > Options > HTTPS tab.
Enable Capture HTTPS CONNECTs.
Check Decrypt HTTPS traffic.
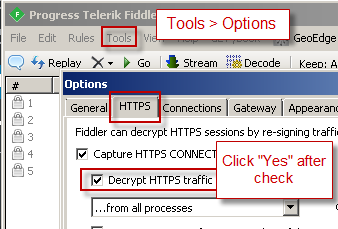
When prompted, install the Fiddler Root Certificate (this allows Fiddler to intercept and decrypt HTTPS traffic securely).
This enables capturing and inspecting encrypted web traffic.
Open Fiddler.
Go to Tools > Options > HTTPS tab.
Enable Capture HTTPS CONNECTs.
Check Decrypt HTTPS traffic.
When prompted, install the Fiddler Root Certificate (this allows Fiddler to intercept and decrypt HTTPS traffic securely).
This enables capturing and inspecting encrypted web traffic.
3. Start Capturing Traffic
Fiddler starts capturing traffic automatically when launched.
If not capturing, click Start Capturing (or press F12).

Open your web browser or application and reproduce the issue you want to debug.
Fiddler starts capturing traffic automatically when launched.
If not capturing, click Start Capturing (or press F12).
Open your web browser or application and reproduce the issue you want to debug.
4. Inspect Captured Traffic
Captured sessions appear in the Sessions list.
Click any session to view detailed info:
Inspectors tab: View Request and Response headers, bodies, cookies, JSON/XML content.
Statistics tab: View timing details like DNS lookup, server processing, and content download time.
Timeline tab: Visualize request/response timing and bottlenecks.

Captured sessions appear in the Sessions list.
Click any session to view detailed info:
Inspectors tab: View Request and Response headers, bodies, cookies, JSON/XML content.
Statistics tab: View timing details like DNS lookup, server processing, and content download time.
Timeline tab: Visualize request/response timing and bottlenecks.
5. Filter Traffic

Use the Filters tab to narrow down visible traffic.
Filter by:
Host/domain name (e.g., api.example.com).
HTTP status codes (e.g., 400-599 for errors).
Content types (e.g., JSON, images).
Process names (e.g., chrome.exe).
Filtering reduces noise and helps focus on relevant traffic.
Use the Filters tab to narrow down visible traffic.
Filter by:
Host/domain name (e.g.,
api.example.com).HTTP status codes (e.g., 400-599 for errors).
Content types (e.g., JSON, images).
Process names (e.g., chrome.exe).
Filtering reduces noise and helps focus on relevant traffic.
6. Modify and Replay Requests
Right-click a session → Replay > Reissue and Edit to resend a request.
Use Set Breakpoint to pause before sending requests or receiving responses:
Right-click → Set Breakpoint > Before Request or Before Response.
Edit headers, request body, or response content in the Inspectors pane.
Resume traffic by clicking Run to Completion.
Useful for testing changes without changing server code.
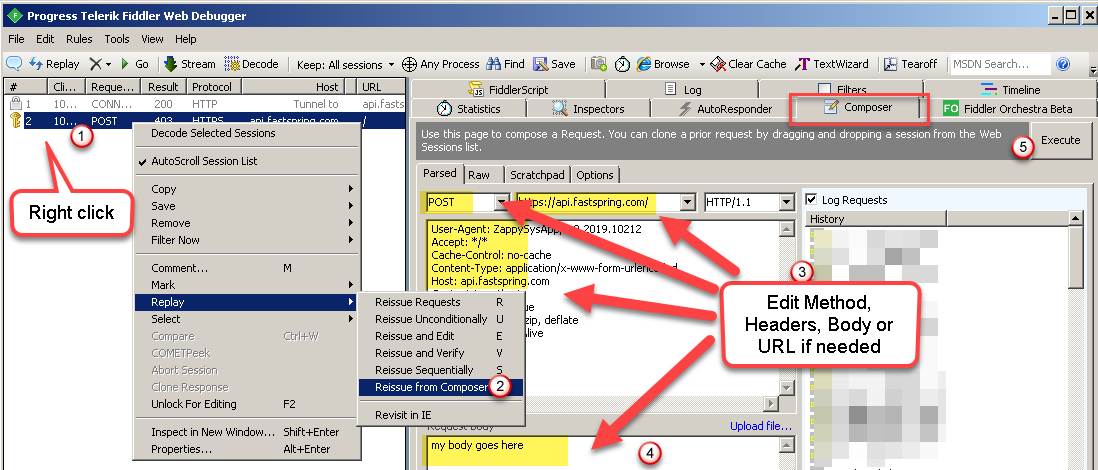
Right-click a session → Replay > Reissue and Edit to resend a request.
Use Set Breakpoint to pause before sending requests or receiving responses:
Right-click → Set Breakpoint > Before Request or Before Response.
Edit headers, request body, or response content in the Inspectors pane.
Resume traffic by clicking Run to Completion.
Useful for testing changes without changing server code.
7. Use AutoResponder to Mock Responses
Go to AutoResponder tab.
Create rules to match requests (URL or headers).
Serve custom responses or error codes (e.g., simulate 500 Internal Server Error).
Great for testing client-side error handling or app behavior without server changes.
Go to AutoResponder tab.
Create rules to match requests (URL or headers).
Serve custom responses or error codes (e.g., simulate 500 Internal Server Error).
Great for testing client-side error handling or app behavior without server changes.
Common Scenarios with Fiddler and Examples
Scenario What to Do Example Webpage won’t load or slow Capture HTTP requests, check response times Find a 3rd party script delaying page load API returns 403 Forbidden Inspect headers, tokens, authentication info Verify if OAuth token is missing or expired SSL/TLS certificate errors Capture HTTPS handshake, check certificate info Identify if the SSL certificate is invalid or expired Debug JSON payload errors View and edit JSON request/response bodies Fix malformed JSON being sent in POST requests Test app behavior on errors Use AutoResponder to simulate 500 or 404 Check if app retries or shows error messages properly Filter noisy traffic Use Filters to show requests to one API domain Focus only on calls to api.yourservice.com
| Scenario | What to Do | Example |
|---|---|---|
| Webpage won’t load or slow | Capture HTTP requests, check response times | Find a 3rd party script delaying page load |
| API returns 403 Forbidden | Inspect headers, tokens, authentication info | Verify if OAuth token is missing or expired |
| SSL/TLS certificate errors | Capture HTTPS handshake, check certificate info | Identify if the SSL certificate is invalid or expired |
| Debug JSON payload errors | View and edit JSON request/response bodies | Fix malformed JSON being sent in POST requests |
| Test app behavior on errors | Use AutoResponder to simulate 500 or 404 | Check if app retries or shows error messages properly |
| Filter noisy traffic | Use Filters to show requests to one API domain | Focus only on calls to api.yourservice.com |
Example: Debugging a Failing API Call
Launch Fiddler and enable HTTPS decryption.
In your app, perform the API call that’s failing.
In Fiddler, locate the request to the API endpoint.
Click it and check the Request Headers for missing or incorrect Authorization tokens.
View the Response status code and body for error messages.
Use the Timeline tab to check server response time.
Modify the request header via breakpoint, add a valid token, and replay to confirm fix.
Launch Fiddler and enable HTTPS decryption.
In your app, perform the API call that’s failing.
In Fiddler, locate the request to the API endpoint.
Click it and check the Request Headers for missing or incorrect Authorization tokens.
View the Response status code and body for error messages.
Use the Timeline tab to check server response time.
Modify the request header via breakpoint, add a valid token, and replay to confirm fix.
Best Practices
Always disable capturing when done to save resources.
Use filters early to avoid overwhelming traffic logs.
Export sessions via File > Save to share with teams.
Be careful with sensitive data — sanitize logs before sharing.
Use the latest version of Fiddler for improved HTTPS and protocol support.
Always disable capturing when done to save resources.
Use filters early to avoid overwhelming traffic logs.
Export sessions via File > Save to share with teams.
Be careful with sensitive data — sanitize logs before sharing.
Use the latest version of Fiddler for improved HTTPS and protocol support.
Summary
Fiddler is a versatile and powerful tool for anyone working with web applications or APIs. From inspecting live traffic, debugging authentication, simulating network errors, to performance analysis — it covers almost every need in HTTP/HTTPS troubleshooting.
How to Use HAR Files: A Complete Guide for Troubleshooting Web Performance and Network Issues
What is a HAR File?
HAR stands for HTTP Archive. It is a JSON-formatted file that records a browser’s network activity during a web session. A HAR file captures all HTTP and HTTPS requests and responses, including headers, cookies, timings, payload sizes, and status codes.
When to Use HAR Files?
Use HAR files when you need to:
Diagnose slow webpage loading: Identify which resources are causing delays.
Analyze front-end performance: Understand request waterfalls, redirects, and failed resources.
Share network traffic details: Provide a snapshot of browser activity to developers or support teams without live access.
Debug client-side errors: Track failed API calls, missing files, or errors in third-party scripts.
Troubleshoot resource loading issues: See exactly which assets are blocked or missing.
How to Generate HAR Files: Step-by-Step
In Google Chrome
Open Chrome and navigate to the page where you want to capture network activity.
Press F12 or right-click the page and select Inspect to open Developer Tools.
Go to the Network tab.
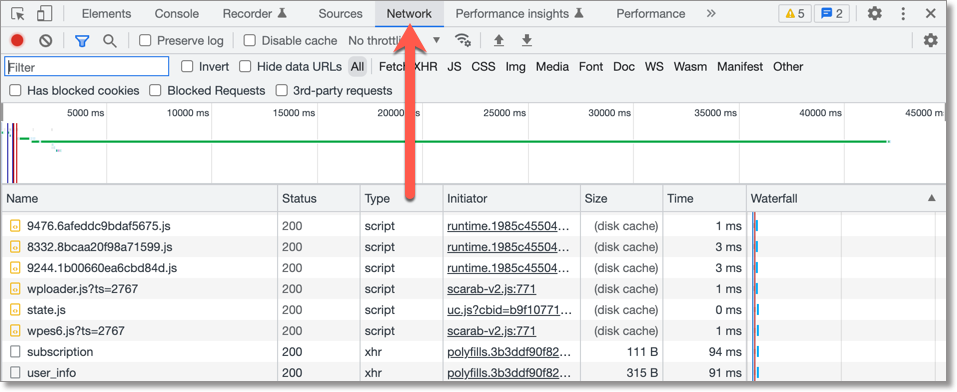
Check the Preserve log checkbox (optional, but useful to keep network data during page reloads or navigation).
Reload the webpage or perform the action causing the issue.
Once done, right-click anywhere in the list of network requests.
Select Save all as HAR with content.
Choose a location and save the .har file.
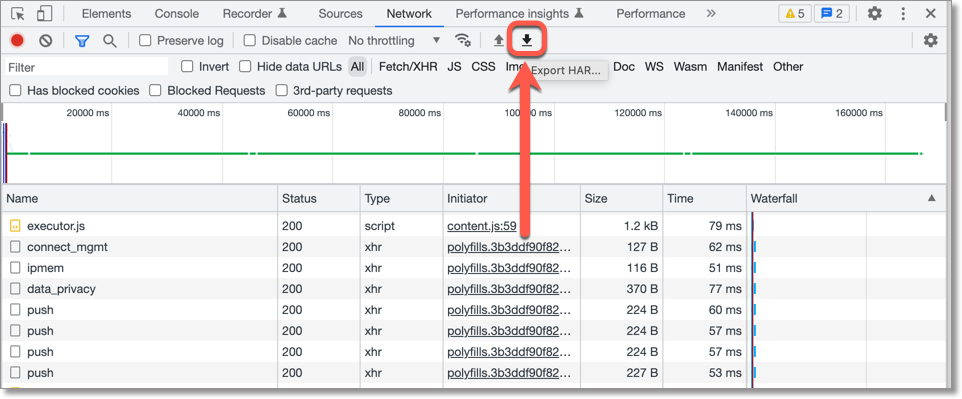
Open Chrome and navigate to the page where you want to capture network activity.
Press F12 or right-click the page and select Inspect to open Developer Tools.
Go to the Network tab.
Check the Preserve log checkbox (optional, but useful to keep network data during page reloads or navigation).
Reload the webpage or perform the action causing the issue.
Once done, right-click anywhere in the list of network requests.
Select Save all as HAR with content.
Choose a location and save the .har file.
In Firefox
Open Firefox and go to the page where you want to record.
Press F12 to open Developer Tools.
Click the Network tab.
Reload the page or perform the needed actions.
Click the gear icon ⚙️ in the Network tab, and select Save all as HAR.
Save the .har file.
Open Firefox and go to the page where you want to record.
Press F12 to open Developer Tools.
Click the Network tab.
Reload the page or perform the needed actions.
Click the gear icon ⚙️ in the Network tab, and select Save all as HAR.
Save the .har file.
How to Analyze HAR Files
Open Chrome DevTools → Network tab → Click the Import HAR button (folder icon).
Load the HAR file.
View the Waterfall chart showing the timeline of each resource loading.
Filter by HTTP status codes to find errors (e.g., 404, 500).
Inspect request and response headers, cookies, and payload size.
Identify slow DNS lookups, long server response times, or stalled connections.
Open Chrome DevTools → Network tab → Click the Import HAR button (folder icon).
Load the HAR file.
View the Waterfall chart showing the timeline of each resource loading.
Filter by HTTP status codes to find errors (e.g., 404, 500).
Inspect request and response headers, cookies, and payload size.
Identify slow DNS lookups, long server response times, or stalled connections.
Common Scenarios and How HAR Files Help
Scenario What to Look For How HAR Helps Slow webpage loading Long wait times, blocked requests, or slow DNS Pinpoints exactly which resource or step causes delays Missing or failed resources 404 Not Found or 500 Internal Server Error Shows which files failed to load and their impact Excessive redirects Multiple 3xx status codes Detects redirect loops or unnecessary redirects Third-party scripts failing Errors or delays in scripts from external domains Identifies problematic third-party resources slowing page API call failures 4xx/5xx status codes and response payloads Helps debug frontend API issues by analyzing failed requests
| Scenario | What to Look For | How HAR Helps |
|---|---|---|
| Slow webpage loading | Long wait times, blocked requests, or slow DNS | Pinpoints exactly which resource or step causes delays |
| Missing or failed resources | 404 Not Found or 500 Internal Server Error | Shows which files failed to load and their impact |
| Excessive redirects | Multiple 3xx status codes | Detects redirect loops or unnecessary redirects |
| Third-party scripts failing | Errors or delays in scripts from external domains | Identifies problematic third-party resources slowing page |
| API call failures | 4xx/5xx status codes and response payloads | Helps debug frontend API issues by analyzing failed requests |
Example: Troubleshooting a Slow Checkout Page
Open Developer Tools → Network tab.
Enable Preserve log to keep requests while moving between pages.
Perform actions on the checkout page.
Save the HAR file after checkout completes or issue reproduces.
Load the HAR in Chrome DevTools or send it to the development team.
Review the waterfall to find slow-loading assets or failed API calls causing delays.
Open Developer Tools → Network tab.
Enable Preserve log to keep requests while moving between pages.
Perform actions on the checkout page.
Save the HAR file after checkout completes or issue reproduces.
Load the HAR in Chrome DevTools or send it to the development team.
Review the waterfall to find slow-loading assets or failed API calls causing delays.
Best Practices for HAR Files
Always enable "Preserve log" if you want to capture across page reloads or navigation.
Limit HAR capture duration to reduce file size.
Avoid sharing sensitive info — HAR files may contain personal data or auth tokens.
Use HAR files as a snapshot, useful for offline analysis or when remote debugging isn’t possible.
Combine HAR file analysis with other tools like Fiddler or Wireshark for deeper troubleshooting.
Always enable "Preserve log" if you want to capture across page reloads or navigation.
Limit HAR capture duration to reduce file size.
Avoid sharing sensitive info — HAR files may contain personal data or auth tokens.
Use HAR files as a snapshot, useful for offline analysis or when remote debugging isn’t possible.
Combine HAR file analysis with other tools like Fiddler or Wireshark for deeper troubleshooting.
Summary
HAR files are an excellent way to capture and share detailed browser network activity, especially useful for frontend performance troubleshooting and debugging client-side web issues. They provide a quick, portable snapshot that anyone on your team can analyze without requiring live access.
__________________
Wireshark: A Complete Guide for Network Packet Capture and Troubleshooting
What is Wireshark?
Wireshark is a powerful, open-source network protocol analyzer that captures and inspects network traffic at a very detailed packet level. Unlike tools that focus only on HTTP or application-layer traffic, Wireshark lets you see all network packets flowing through your network interface — including TCP/IP, DNS, DHCP, SSL/TLS, VoIP, and many more protocols.
When to Use Wireshark?
Use Wireshark when you need to:
Diagnose low-level network issues like packet loss, retransmissions, or latency.
Analyze non-HTTP protocols such as DNS, DHCP, TCP handshakes, or VoIP.
Investigate security issues by spotting unusual or suspicious network traffic.
Troubleshoot network connectivity problems or performance bottlenecks.
Understand detailed packet flows for complex troubleshooting or network audits.
How to Set Up and Use Wireshark
Step 1: Download and Install Wireshark
Go to wireshark.org and download the latest stable version.
During installation on Windows, also install Npcap (required for packet capture).
Launch Wireshark with administrator or root privileges for full network capture.
Go to wireshark.org and download the latest stable version.
During installation on Windows, also install Npcap (required for packet capture).
Launch Wireshark with administrator or root privileges for full network capture.
Step 2: Select the Network Interface to Capture
When Wireshark opens, it displays a list of available network interfaces (Wi-Fi, Ethernet, VPN, etc.).
Choose the interface through which your traffic flows (e.g., Wi-Fi for wireless connections).
Click the Start Capture (shark fin icon) to begin capturing live packets.
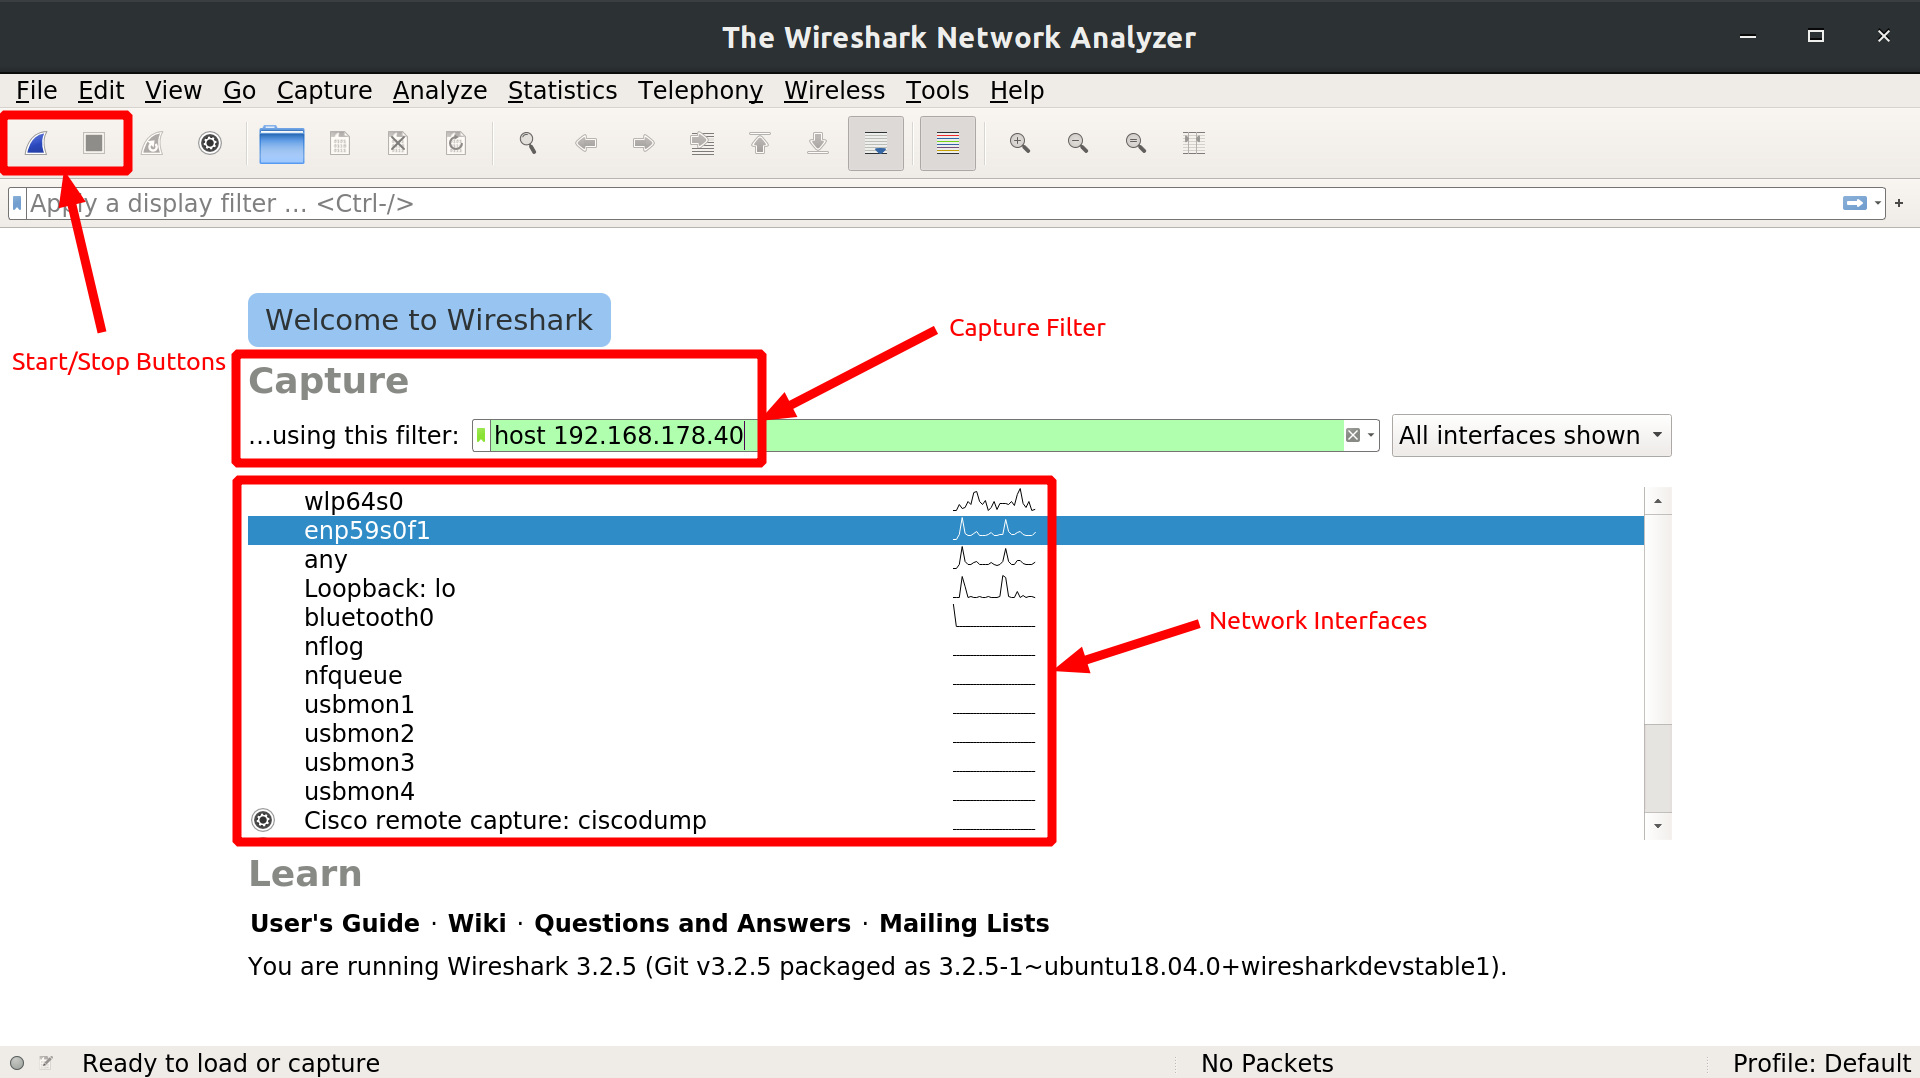
When Wireshark opens, it displays a list of available network interfaces (Wi-Fi, Ethernet, VPN, etc.).
Choose the interface through which your traffic flows (e.g., Wi-Fi for wireless connections).
Click the Start Capture (shark fin icon) to begin capturing live packets.
Step 3: Reproduce the Issue
While Wireshark is capturing, perform the network action or reproduce the connectivity/performance problem you want to diagnose.
While Wireshark is capturing, perform the network action or reproduce the connectivity/performance problem you want to diagnose.
Step 4: Stop the Capture
Click the red Stop button once you have enough data.
Click the red Stop button once you have enough data.
Wireshark Filters: Focus on What Matters
Wireshark captures all network traffic on the interface, which can be overwhelming. Filters help you narrow down to relevant packets.
To display packets using the HTTP protocol you can enter the following filter in the Display Filter Toolbar:

To display all the HTTP traffic you need to use the following protocol and port display filter:
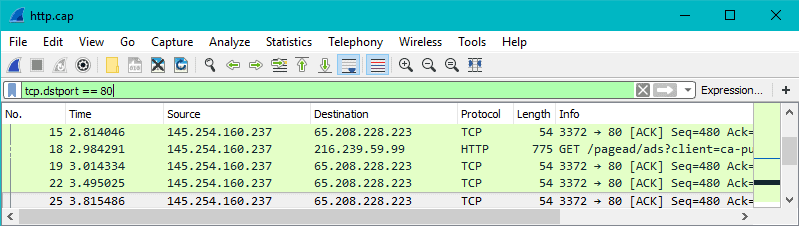
Filtering HTTP Traffic to and from Specific IP Address in Wireshark
If you want to filter for all HTTP traffic exchanged with a specific you can use the “and” operator. If, for example, you wanted to see all HTTP traffic related to a site at xxjsj you could use the following filter:
tcp.port == 80 and ip.addr == 65.208.228.223

Notice only packets with 65.208.228.223 in either the source or destination columns is shown. You can also use the OR or || operators to create an “either this or that” filter.
tcp.port == 80 || ip.addr == 65.208.228.223
Wireshark HTTP Method Filter
If you want to dig into your HTTP traffic you can filter for things like GET, PUT, POST, DELETE, HEAD, OPTIONS, CONNECT, and TRACE. To filter for these methods use the following filter syntax:
http.request.method == requestmethod
For example, if you wanted to filter for just the GET requests, enter the following filter in the Display Filter toolbar:
http.request.method == “GET”

Now you’re left with all of the GET requests for assets from the website.
Viewing HTTP Packet Information in Wireshark
Working with the GET Method Filter displayed above, click on a packet in the Packet List Pane and then look at the information in the Packet Details Pane. Expand the Hypertext Transfer Protocol detail:

To filter for a specific response, such as a HTTP 200 (OK), HTTP 301 (Moved Permanently), or HTTP 404 (Not Found) use the following display filter:
http.response.code == 200

Change 200 to another code to search for that code. Here is a list of HTTP Status Codes.
Follow the Full HTTP Stream to Match Get Requests with Responses
A very handy feature of Wireshark is the ability to view streams in a human readable format from beginning to end. To this, pick a HTTP protocol packet such as the packet containing the 200 response that we saw earlier and right click on it. Click on Follow -> HTTP Stream.

You’ll now be presented with a window that shows the entire stream including the GET (red) and HTTP/1.1 200 OK (Blue)

As you can see, there is a lot to HTTP traffic and just filtering for the HTTP protocol doesn’t cut it.
Common Display Filters with Examples
Filter Purpose Example Use Case ip.addr == 192.168.1.10Show all packets to or from a specific IP Focus on traffic involving a particular client or server tcp.port == 443Show traffic on TCP port 443 (HTTPS) Analyze HTTPS sessions dnsDisplay only DNS protocol packets Troubleshoot DNS lookup failures tcp.analysis.retransmissionShow TCP retransmissions (packet loss) Identify network packet loss causing slow connections icmpDisplay ICMP packets (ping, traceroute) Check connectivity using ping or traceroute requests bootpShow DHCP traffic (BOOTP protocol) Diagnose IP address assignment issues tls.handshakeDisplay TLS/SSL handshake messages Debug SSL/TLS connection failures httpShow HTTP traffic Inspect web page requests and responses
| Filter | Purpose | Example Use Case |
|---|---|---|
ip.addr == 192.168.1.10 | Show all packets to or from a specific IP | Focus on traffic involving a particular client or server |
tcp.port == 443 | Show traffic on TCP port 443 (HTTPS) | Analyze HTTPS sessions |
dns | Display only DNS protocol packets | Troubleshoot DNS lookup failures |
tcp.analysis.retransmission | Show TCP retransmissions (packet loss) | Identify network packet loss causing slow connections |
icmp | Display ICMP packets (ping, traceroute) | Check connectivity using ping or traceroute requests |
bootp | Show DHCP traffic (BOOTP protocol) | Diagnose IP address assignment issues |
tls.handshake | Display TLS/SSL handshake messages | Debug SSL/TLS connection failures |
http | Show HTTP traffic | Inspect web page requests and responses |
How to Apply Filters
In the top filter bar, type your filter expression (e.g., ip.addr == 10.0.0.5).
Press Enter to apply the filter.
Combine filters using logical operators (and, or), e.g., ip.addr == 10.0.0.5 and tcp.port == 80.
In the top filter bar, type your filter expression (e.g., ip.addr == 10.0.0.5).
Press Enter to apply the filter.
Combine filters using logical operators (and, or), e.g., ip.addr == 10.0.0.5 and tcp.port == 80.
How to Analyze Captured Packets
Packet List Pane: Shows each captured packet in summary form.
Packet Details Pane: Displays detailed protocol info and headers for the selected packet.
Packet Bytes Pane: Shows raw packet data in hex and ASCII.
Packet List Pane: Shows each captured packet in summary form.
Packet Details Pane: Displays detailed protocol info and headers for the selected packet.
Packet Bytes Pane: Shows raw packet data in hex and ASCII.
Useful Analysis Tips
Right-click a packet and select Follow → TCP Stream to view the full conversation.
Use Statistics menu for protocol hierarchy, endpoint conversations, IO graphs, and flow diagrams.
Export specific packets for sharing via File → Export Specified Packets.
Right-click a packet and select Follow → TCP Stream to view the full conversation.
Use Statistics menu for protocol hierarchy, endpoint conversations, IO graphs, and flow diagrams.
Export specific packets for sharing via File → Export Specified Packets.
Common Troubleshooting Scenarios with Wireshark
Scenario What to Look For Wireshark Insight Packet loss causing slow app TCP retransmissions, duplicate ACKs Confirm network issues causing delays DNS resolution failures DNS queries and responses, errors Pinpoint DNS server or configuration problems DHCP issues DHCP Discover, Offer, Request, Ack messages Detect IP address assignment failures SSL/TLS handshake failure TLS handshake messages, alert messages Diagnose certificate or negotiation issues Unusual network activity Unknown ports, suspicious protocols Spot potential malware or security threats
| Scenario | What to Look For | Wireshark Insight |
|---|---|---|
| Packet loss causing slow app | TCP retransmissions, duplicate ACKs | Confirm network issues causing delays |
| DNS resolution failures | DNS queries and responses, errors | Pinpoint DNS server or configuration problems |
| DHCP issues | DHCP Discover, Offer, Request, Ack messages | Detect IP address assignment failures |
| SSL/TLS handshake failure | TLS handshake messages, alert messages | Diagnose certificate or negotiation issues |
| Unusual network activity | Unknown ports, suspicious protocols | Spot potential malware or security threats |
Example: Diagnosing Packet Loss on a Video Stream
Start Wireshark capture on your active network interface.
Play the video stream to generate traffic.
Stop capture after the issue appears.
Apply filter: tcp.analysis.retransmission to see retransmitted packets.
Inspect timing and sequence numbers to understand packet loss and delays.
Start Wireshark capture on your active network interface.
Play the video stream to generate traffic.
Stop capture after the issue appears.
Apply filter: tcp.analysis.retransmission to see retransmitted packets.
Inspect timing and sequence numbers to understand packet loss and delays.
Final Tips
Always run Wireshark with proper permissions to capture all traffic.
Use filters early to reduce noise and focus on the issue.
Avoid capturing unnecessarily long sessions to minimize file sizes.
Remember Wireshark captures sensitive data — handle capture files securely.
Combine Wireshark insights with application-level logs or browser tools for holistic troubleshooting.
Always run Wireshark with proper permissions to capture all traffic.
Use filters early to reduce noise and focus on the issue.
Avoid capturing unnecessarily long sessions to minimize file sizes.
Remember Wireshark captures sensitive data — handle capture files securely.
Combine Wireshark insights with application-level logs or browser tools for holistic troubleshooting.

No comments:
Post a Comment